mtr链路监控
系统环境:centos7.6
1、安装MTR
系统默认安装有mtr工具,如果没有可以自己下载安装,但是本次演示环境要用到的mtr版本为0.93,而系统自带的是0.85,区别在于是否支持json,而当前最新版是0.95,但是最新版也不支持json,支持json的最高版本就是0.93,所以先去下载0.93版的mtr,下载地址:
https://github.com/traviscross/mtr/releases/tag/v0.93
[root@localhost dl]# ls
v0.93.tar.gz
[root@localhost dl]# tar -zxvf v0.93.tar.gz
[root@localhost dl]# ls
mtr-0.93  v0.93.tar.gz
[root@localhost dl]# cd mtr-0.93/
[root@localhost mtr-0.93]# ls
AUTHORS          BSDCOPYING    COPYING  Makefile.am  packet       SECURITY  ui
bash-completion  build-aux     FORMATS  man          portability  test
bootstrap.sh     configure.ac  img      NEWS         README.md    TODO
[root@localhost mtr-0.93]# ./bootstrap.sh
./bootstrap.sh: line 3: aclocal: command not found
./bootstrap.sh: line 4: autoheader: command not found
./bootstrap.sh: line 5: automake: command not found
./bootstrap.sh: line 6: autoconf: command not found
[root@localhost mtr-0.93]#
提示没有依赖的包,安装这些依赖
[root@localhost mtr-0.93]# yum -y install aclocal autoheader automake autoconf
[root@localhost mtr-0.93]# ls
aclocal.m4       bootstrap.sh  configure     img          NEWS         SECURITY
AUTHORS          BSDCOPYING    configure.ac  Makefile.am  packet       test
autom4te.cache   build-aux     COPYING       Makefile.in  portability  TODO
bash-completion  config.h.in   FORMATS       man          README.md    ui
[root@localhost mtr-0.93]# ./configure
[root@localhost mtr-0.93]# make && make install
[root@localhost mtr-0.93]# source /etc/profile
[root@localhost ~]# mtr -version
mtr UNKNOWN
[root@localhost ~]#
虽然版本显示未知,但不影响使用
2、安装mtr-monitor
下载地址:
下载解压后目录内容如下:
[root@localhost mtr-monitor]# pwd
/data/dl/mtr-monitor
[root@localhost mtr-monitor]# ls
grafana      influx-cli.sh  Makefile             mtr-monitor.sh  requirements.txt
grafana.ini  influxdb       mtr-monitor.service  README.md       save_data.py
[root@localhost mtr-monitor]#
Makefile文件中可以配置工具安装的路径
[root@localhost mtr-monitor]# cat Makefile
install:
install -m 755 -d /data/mtr-monitor
cp -r grafana /data/mtr-monitor/
chown -R 472:472 /data/mtr-monitor/grafana
cp -r influxdb /data/mtr-monitor/
chown -R root:root /data/mtr-monitor/influxdb
install -D -m 644 grafana.ini /data/mtr-monitor/grafana.ini
install -D -m 744 influx-cli.sh /data/mtr-monitor/influx-cli.sh
install -D -m 744 mtr-monitor.sh /data/mtr-monitor/mtr-monitor.sh
install -D -m 644 README.md /data/mtr-monitor/README.md
install -D -m 644 requirements.txt /data/mtr-monitor/requirements.txt
install -D -m 744 save_data.py /data/mtr-monitor/save_data.py
install -D -m 744 mtr-monitor.service /usr/lib/systemd/system/mtr-monitor.service
[root@localhost mtr-monitor]#
我这里配置安装到/data/目录下,安装
[root@localhost mtr-monitor]# make install
启动、关闭、重启服务都可以试用systemctl,服务名称:mtr-monitor
服务脚本中有使用到python3,安装过程省略了,python3安装好之后再使用pip3安装influxdb模块,模块版本号也有要求,在软件目录下的 requirements.txt文件中:
[root@localhost mtr-monitor]# pwd
/data/mtr-monitor
[root@localhost mtr-monitor]# ls
grafana      influx-cli.sh  mtr-monitor.sh  requirements.txt  test.txt
grafana.ini  influxdb       README.md       save_data.py
[root@localhost mtr-monitor]# cat requirements.txt
influxdb==3.0.0
[root@localhost mtr-monitor]# pip3 install influxdb==3.0.0
mtr-monitor默认使用docker来运行influxdb和grafna,这里不使用docker,所以在配置文件中修改这两个地方
[root@localhost mtr-monitor]# cat mtr-monitor.sh
# set to no to not download & start docker image with influx
INFLUXDB_DOCKER="no"
# set to "no" to not download & start grafana docker image
GRAFANA_DOCKER="no"
把默认yes改为no
3、安装influxdb
最新版本仅支持1.7.11,下载地址:
下载rpm包安装即可
[root@localhost ~]# systemctl start influxdb
[root@localhost ~]# influx
Connected to http://localhost:8086 version 1.7.11
InfluxDB shell version: 1.7.11
>
>
# 显示用户
SHOW USERS
# 创建用户
CREATE USER "username" WITH PASSWORD 'password'
# 创建管理员权限的用户
CREATE USER "username" WITH PASSWORD 'password' WITH ALL PRIVILEGES
# 删除用户
DROP USER "username"
#查询measurements
show measurements
#查询tag key
show tag keys
show tag keys from "xxx"
#查询tag value
show tag values
show tag values from “xxx” with key=“aaa”
show tag values with key=xxx
#限定查询,根据tag值来查询measurements,tagName为tag名称
show measurements where tagName='aaa'
更多高级查询功能参考这里
http://t.zoukankan.com/thewindyz-p-14079128.html
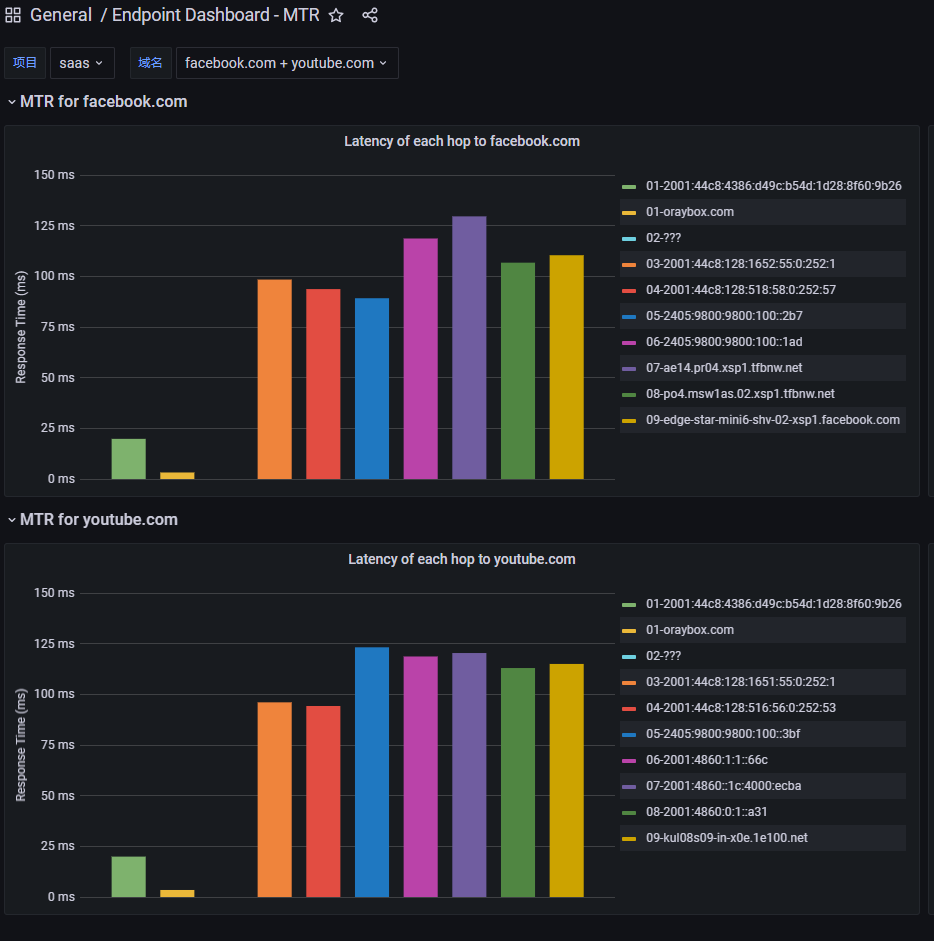
4、安装grafana面板
首先在grafana中添加influxdb的数据源,influxdb填写之前安装的,需要提前配置好用户名密码和数据库名称,然后导入id为3288的面板
5、扩展需求
默认面板不能对域名进行分类,需要实现对域名进行按项目分类,需要修改的地方如下:
5.1 mtr-monitor.sh
#增加XM变量,给个值csc
XM=csc
#增加传给python脚本的变量数,加在最后
mtr --report --json --report-cycles $CYCLES $MTR_HOST | $WORKDIR/save_data.py --host $INFLUXDB_HOST--port $INFLUXDB_PORT --xm $XM
5.2 save_data.py
#增加xm的tag
class HubEntry(SeriesHelper):
class Meta:
series_name = '{destination}'
fields = ['time', 'loss', 'snt', 'last', 'avg', 'best', 'wrst', 'stdev']
tags = ['destination', 'hop', 'xm']
def get_cmd_arguments():
parser = argparse.ArgumentParser(description='JSON parser')
parser.add_argument('--host', default='192.168.6.20', help='influxdb host')
parser.add_argument('--port', default=8086, help='influxdb port')
parser.add_argument('--xm', default='none', help='xm')
def main():
args = get_cmd_arguments()
db_client = InfluxDBClient(args.host, args.port, user, password, db_name)
xm = args.xm
#在HubEntry对象中增加xm值
HubEntry(
time=report_time,
destination=destination,
hop=hop,
xm=xm,
loss=hub['Loss%'],
snt=hub['Snt'],
last=hub['Last'],
avg=hub['Avg'],
best=hub['Best'],
wrst=hub['Wrst'],
stdev=hub['StDev']
)
5.3 grafana面板
给3288面板增加xmname的变量,变量的语句为:show tag values with key=xm
将此变量移动到默认变量的上面
修改默认mtr_endpoint变量,将变量语句改为:show measurements where xm=’$xmname’
完成。
效果图